import matplotlib.pyplot as plt
import numpy as np27 Matplotlib
The very basics of matplotlib
The first example from the ([docs])
x = np.linspace(0, 2 * np.pi, 200)
y = np.sin(x)

fig, ax = plt.subplots()
ax.plot(x, y)
plt.show()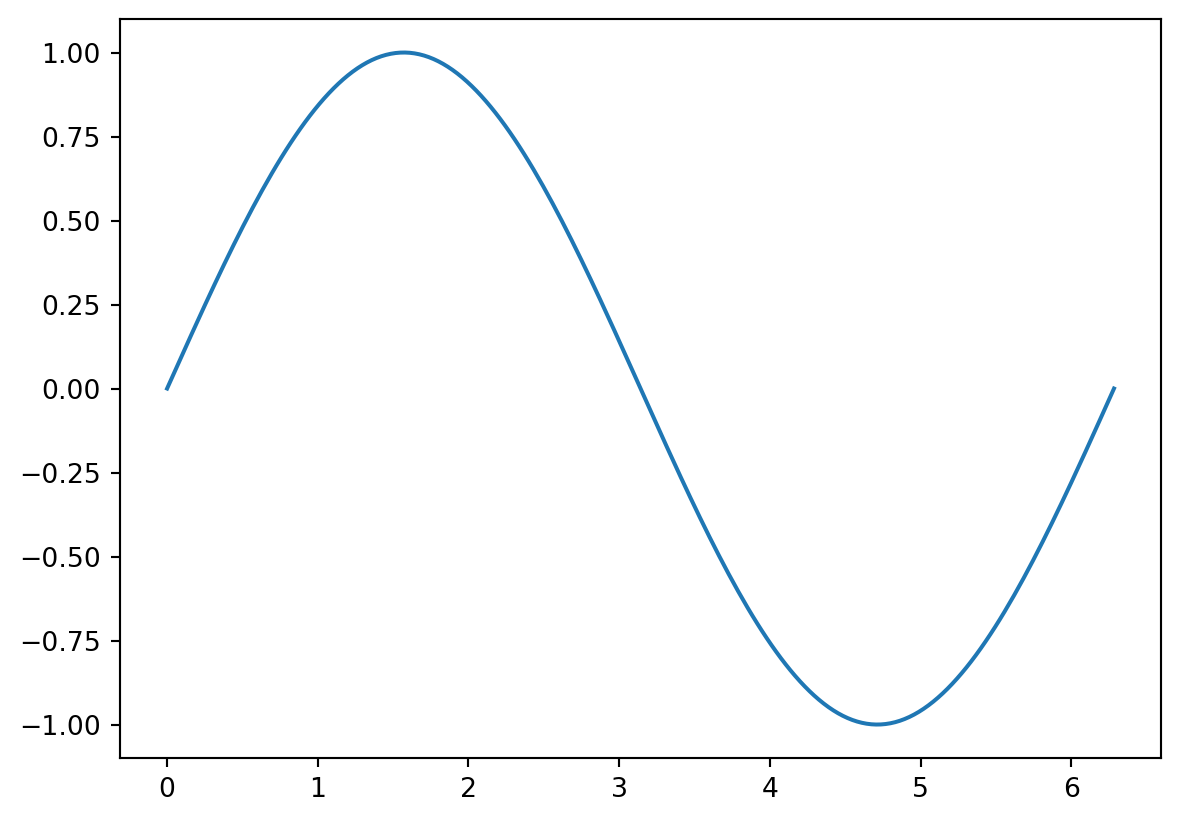
27.1 Boxplot
x = np.random.randn(300)
y = np.random.randn(400) + 1.6
z = np.random.randn(320) - 2.2plt.boxplot(x);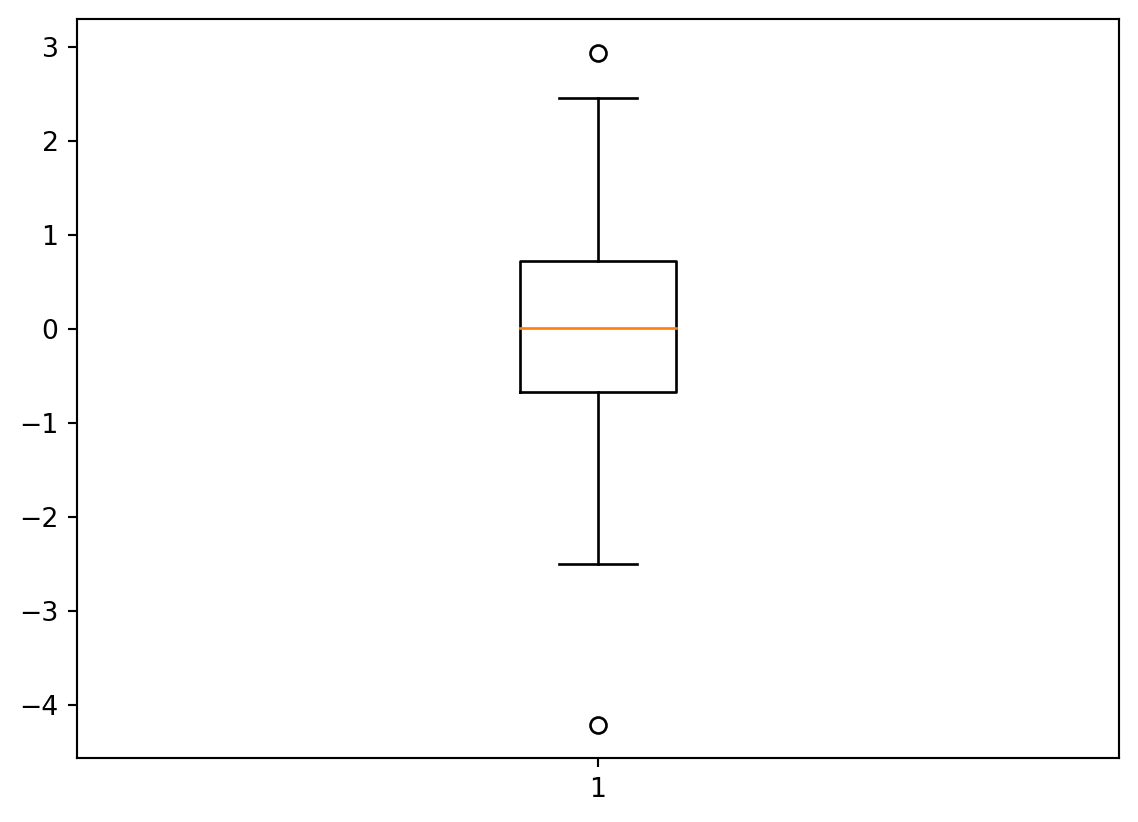
plt.boxplot([x, y, z]);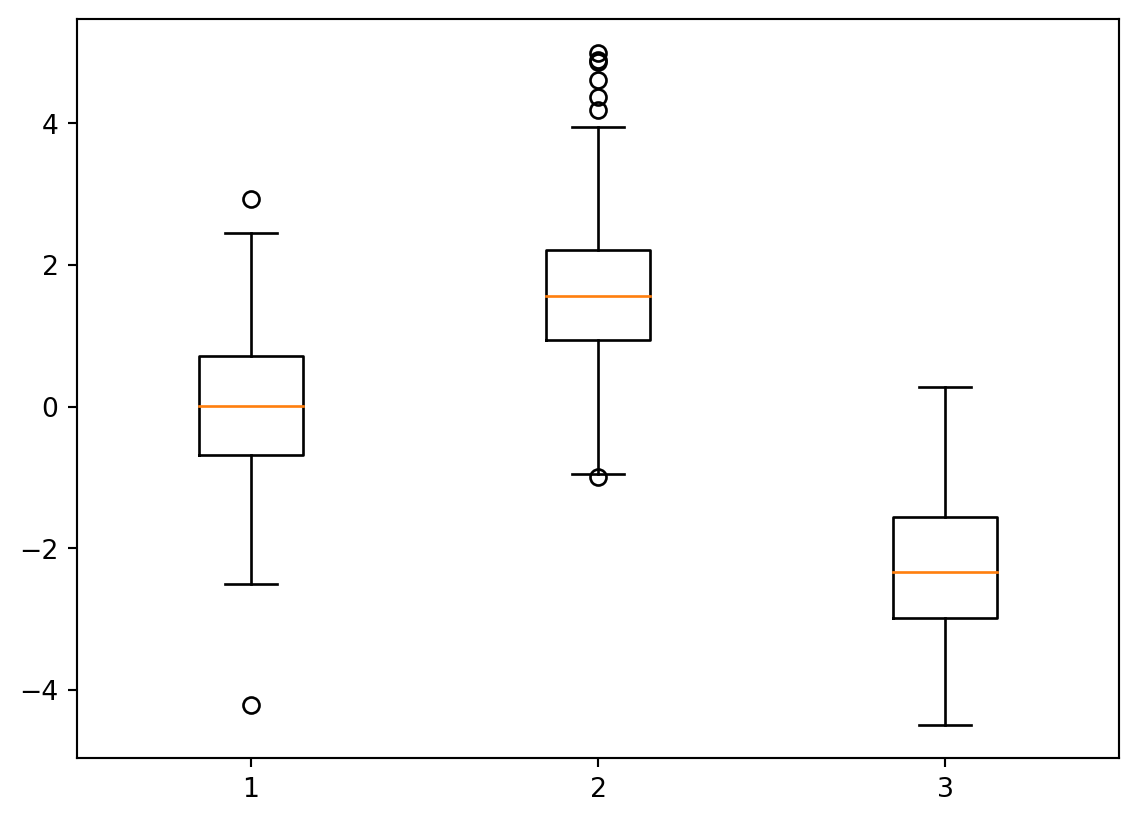
27.2 Histogram
plt.hist(x, bins=32)(array([ 2., 0., 4., 5., 0., 9., 7., 7., 9., 13., 11., 12., 15.,
21., 17., 18., 19., 20., 16., 15., 14., 15., 18., 8., 6., 8.,
1., 2., 3., 1., 0., 4.]),
array([-2.64542499, -2.4828765 , -2.32032802, -2.15777953, -1.99523105,
-1.83268257, -1.67013408, -1.5075856 , -1.34503712, -1.18248863,
-1.01994015, -0.85739167, -0.69484318, -0.5322947 , -0.36974622,
-0.20719773, -0.04464925, 0.11789923, 0.28044772, 0.4429962 ,
0.60554469, 0.76809317, 0.93064165, 1.09319014, 1.25573862,
1.4182871 , 1.58083559, 1.74338407, 1.90593255, 2.06848104,
2.23102952, 2.393578 , 2.55612649]),
<BarContainer object of 32 artists>)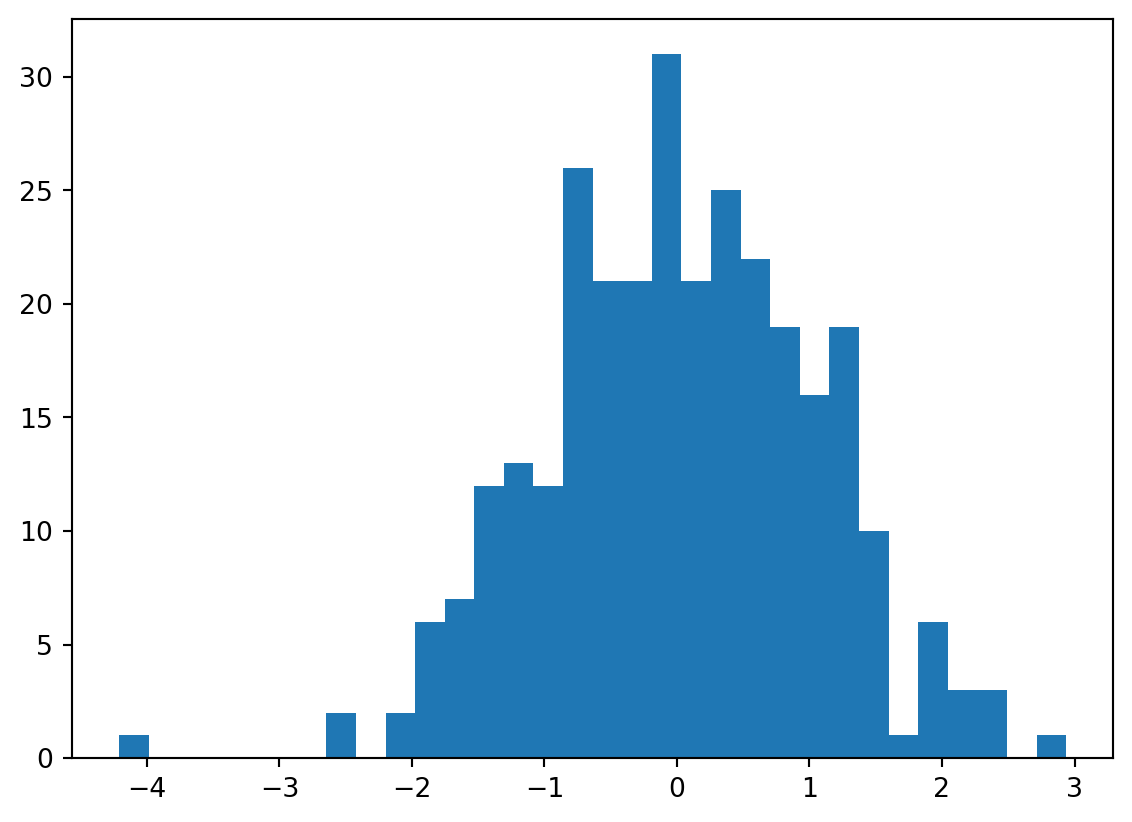
plt.hist([x, y, z])(array([[ 0., 0., 1., 24., 53., 99., 90., 27., 6., 0.],
[ 0., 0., 0., 0., 6., 33., 92., 151., 89., 29.],
[ 6., 26., 94., 115., 59., 18., 2., 0., 0., 0.]]),
array([-5.22670733, -4.32343814, -3.42016895, -2.51689976, -1.61363057,
-0.71036137, 0.19290782, 1.09617701, 1.9994462 , 2.90271539,
3.80598459]),
<a list of 3 BarContainer objects>)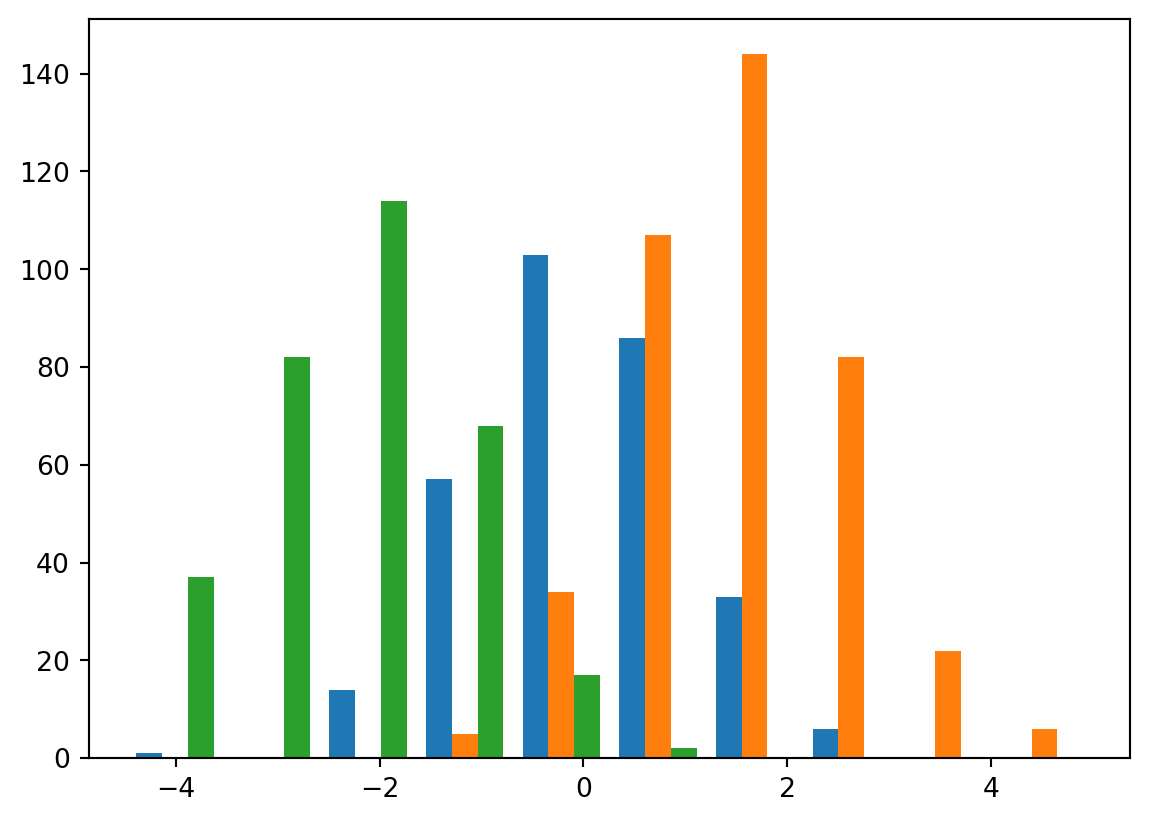
27.3 Scatter
x = np.random.randn(300);
y = 3 + x**3 + np.random.randn(300);
y2 = 4 + x**2 + np.random.randn(300);
plt.scatter(x, y)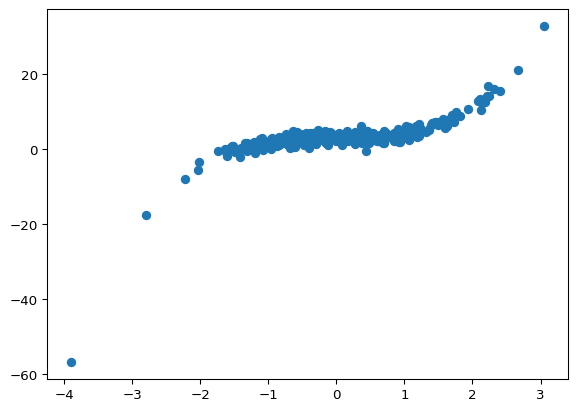
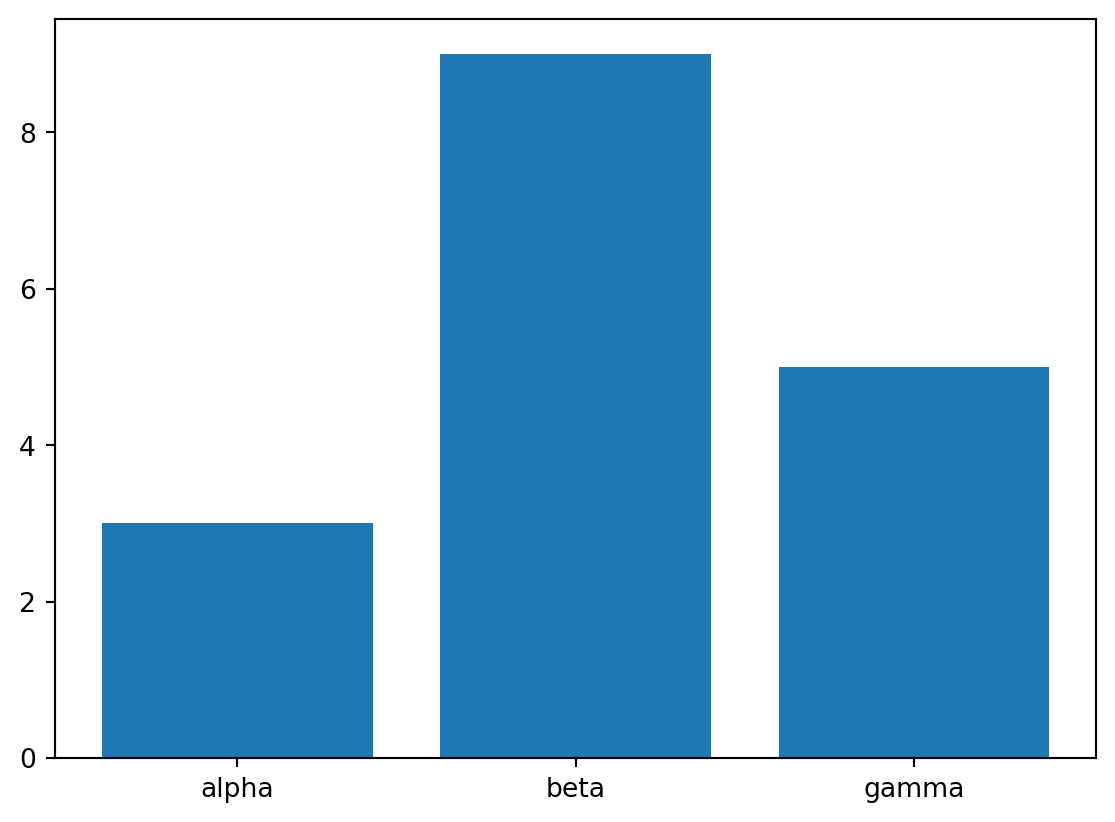
27.4 Barplot
x = np.array(["alpha", "beta", "gamma"])
y = np.array([3, 9, 5])
y2 = np.array([5, 8, 7])
plt.bar(x, y);