import sys
sys.version
'3.13.3 (main, Apr 8 2025, 13:54:08) [Clang 16.0.0 (clang-1600.0.26.6)]'import sys
sys.version'3.13.3 (main, Apr 8 2025, 13:54:08) [Clang 16.0.0 (clang-1600.0.26.6)]'import numpy as npnp.random.RandomState(2022);x = np.random.randn(200, 10)
w = np.random.randn(10)y = x @ w + np.random.randn(200)Create resamples using numpy.random
res = np.random.choice(range(200), 160, replace=False)
res
array([ 75, 18, 20, 134, 116, 108, 144, 84, 52, 147, 78, 127, 98,
25, 45, 131, 26, 68, 3, 42, 10, 164, 199, 48, 47, 124,
114, 14, 158, 115, 145, 35, 194, 36, 58, 117, 38, 198, 87,
160, 94, 28, 91, 129, 191, 1, 152, 49, 184, 103, 173, 16,
121, 128, 157, 176, 90, 190, 195, 110, 34, 161, 101, 170, 60,
0, 109, 37, 156, 177, 82, 186, 17, 88, 2, 62, 105, 43,
55, 149, 56, 197, 151, 188, 167, 139, 193, 172, 11, 63, 13,
192, 163, 125, 196, 118, 130, 153, 166, 69, 93, 73, 57, 22,
54, 107, 141, 174, 30, 66, 59, 122, 154, 180, 9, 113, 33,
169, 143, 137, 46, 138, 148, 5, 178, 140, 100, 23, 67, 41,
111, 80, 71, 179, 77, 112, 92, 7, 102, 126, 4, 133, 53,
76, 89, 168, 31, 183, 132, 159, 99, 44, 65, 95, 24, 96,
32, 150, 142, 15])res.size160We used replace=False in our call above to np.random.choice() to make sure we get unique training cases.
We can check it worked:
np.unique(res).size160x_train = x[res]
y_train = y[res]x_test = np.delete(x, res, axis = 0)
y_test = np.delete(y, res, axis = 0)x_train.shape, y_train.shape, x_test.shape, y_test.shape((160, 10), (160,), (40, 10), (40,))from sklearn import linear_model
mod = linear_model.LinearRegression().fit(x_train, y_train)mod.coef_array([ 1.45801597, 0.1327893 , 2.44544153, 0.5472974 , 0.83101274,
0.99438119, -0.07486898, 2.43030079, 0.41241611, -0.15204283])fitted = mod.predict(x_train)predicted = mod.predict(x_test)Using numpy to get mse:
np.mean(np.square(fitted - y_train))np.float64(0.8694548691438907)np.mean(np.square(predicted - y_test))np.float64(1.334468730589362)Using sklearn’s metrics:
from sklearn.metrics import mean_squared_error
mean_squared_error(y_train, fitted)0.8694548691438907mean_squared_error(y_test, predicted)1.334468730589362import matplotlib.pyplot as pltplt.scatter(y_train, fitted)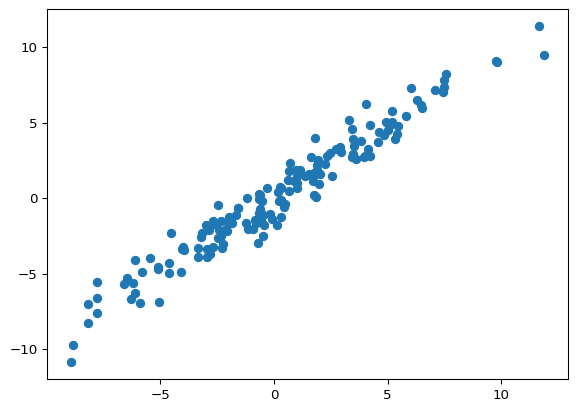
plt.scatter(y_test, predicted)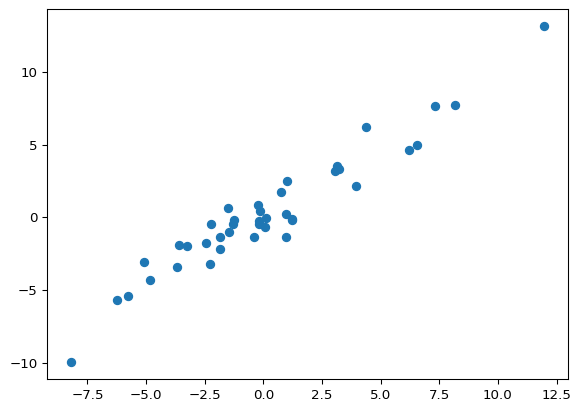
Example: 80% training, 20% testing split
from sklearn.model_selection import train_test_splitx_train, x_test, y_train, y_test = train_test_split(
x, y, test_size=0.2, random_state=2021)x_train.shape, y_train.shape, x_test.shape, y_test.shape((160, 10), (160,), (40, 10), (40,))from sklearn.model_selection import cross_val_scoremod = linear_model.LinearRegression()scores_5fold = cross_val_score(mod, x, y, cv=5)
scores_5foldarray([0.92759413, 0.93698489, 0.94598742, 0.916175 , 0.94421136])The above defaults to scoring='r2', which report r-squared.
Note that if you want to output MSE, you must ask for negative mse - which sklearn uses so that is always maximizes the score:
scores_5fold = cross_val_score(mod,
                               x, y,
                               cv=5,
                               scoring='neg_mean_squared_error')
scores_5fold
array([-1.01210614, -1.25197232, -0.82771319, -0.98879983, -1.21408235])